TCO and ROI have been abused repeatedly by sales representatives, in the hope of getting you to swallow the sometimes outrageously high pricing on their quotation for a trendy new technology. However, server virtualization is one of the few ICT technologies that really lives up to its hype. The cost savings are real and the TCO is great, as long as you obey a few basic rules like not installing bloatware or extremely large memory limited databases. There is more.

Server consolidation is superb for the IT professional who is also a hardware enthusiast (and thus reads it.anandtech.com ?). Hardware purchases used to be motivated by the fact that the equipment was written off or because the maintenance contract was at the end of its life. Can you even think of a more boring reason to buy new hardware? The timeframe between the beginning of the 21st century and the start of commercially viable virtualization solutions was the timeframe where the bean counters ruled the datacenter. Few people were interested in hearing how much faster the newest servers were, as in most cases the extra processing power would go to waste 95% of the time anyway.
Now with virtualization, we hardware nerds are back with a vengeance. Every drop of performance you wring out of your servers translates into potentially higher consolidation ratios (more VMs per physical machine) or better response time per VM. More VMs per machine means immediate short- and long-term cost savings, and better performance per VM means happier users. Yes, performance matters once again and system administrators are seen as key persons, vital to accomplishing the business goals. But how do you know what hardware you should buy for virtualization? There are only two consolidation benchmarks out there: Intel's vConsolidate and VMware's VMmark. Both are cumbersome to set up and both are based on industry benchmarks (SPECJbb2005) that are only somewhat or even hardly representative of real-world applications. The result is that VMmark, despite the fact that it is a valuable benchmark, has turned into yet another OEM benchmark(et)ing tool. The only goal of the OEMs seems to be to produce scores as high as possible; that is understandable from their point of view, but not very useful for the IT professional. Without an analysis of where the extra performance comes from, the scores give a quick first impression but nothing more.
Yes, this article is long overdue, but the Sizing Server Lab proudly presents the AnandTech readers with our newest virtualization benchmark, vApus Mark I, which uses real-world applications in a Windows Server Consolidation scenario. Our goal is certainly not to replace nor to discredit VMmark, but rather to give you another data point -- an independent second opinion based on solid benchmarking. Combining our own testing with what we find on the VMmark page, we will be able to understand the virtualization performance landscape a bit better. Before we dive into the results, let's discuss the reasoning behind some of the choices we made.
The Virtualization Benchmarking Chaos
There are an incredible number of pitfalls in the world of server application benchmarking, and virtualization just makes the whole situation much worse. In this report, we want to measure how well the CPUs are coping with virtualization. That means we need to choose our applications carefully. If we use a benchmark that spends very little time in the hypervisor, we are mostly testing the integer processing power and not how the CPU copes with virtualization overhead. As we have pointed out before, a benchmark like SPECjbb does not tell you much, as it spends less than one percent of its time in the hypervisor.
How is virtualization different? CPU A that beats CPU B in native situations can still be beaten by the latter in virtualized scenarios. There are various reasons why CPU A can still lose, for example CPU A…
- Takes much more time for switching from the VM to hypervisor and vice versa.
- Does not support hardware assisted paging: memory management will cause a lot more hypervisor interventions.
- Has smaller TLBs; Hardware Assisted Paging (EPT, NPT/RVI) places much more pressure on the TLBs.
- Has less bandwidth; an application that needs only 20% of the maximum bandwidth will be bottlenecked if you run six VMs of the same application.
- Has smaller caches; the more VMs, the more pressure there will be on the caches.
To fully understand this, it helps a lot if you read our Hardware Virtualization: the nuts and bolts article. Indeed, some applications run with negligible performance impact inside a virtual machine while others are tangibly slower in a virtualized environment. To get a rough idea of whether or not your application belongs to the latter or former group, a relatively easy rule of thumb can be used: how much time does your application spend in user mode, and how much time does it need help from the kernel? The kernel performs three tasks for user applications:
- System calls (File system, process creation, etc.)
- Interrupts (Accessing the disks, NICs, etc.)
- Memory management (i.e. allocating memory for buffers)
The more work your kernel has to perform for your application, the higher the chance that the hypervisor will need to work hard as well. If your application writes a small log after spending hours crunching numbers, it should be clear it's a typical (almost) "user mode only" application. The prime example of a "kernel intensive" application is an intensively used transactional database server that gets lots of requests from the network (interrupts, system calls), has to access the disks often (interrupts, system calls), and has buffers that grow over time (memory management).
However, a "user mode only" application can still lose a lot of performance in a virtualized environment in some situations:
- Oversubscribing: you assign more CPUs to the virtual machines than physically available. (This is a very normal and common way to get more out of your virtualized server.)
- Cache Contention: your application demands a lot of cache and the other virtualized applications do as well.
These kinds of performance losses are relatively easy to minimize. You could buy CPUs with larger caches, and assign (set affinity) certain cache/CPU hungry applications some of the physical cores. The other less intensive applications would share the CPU cores. In this article, we will focus on the more sensitive workloads out there that do quite a bit of I/O (and thus interrupts), need large memory buffers, and thus talk to the kernel a lot. This way we can really test the virtualization capabilities of the servers.
The Quest for an Independent Real-World Virtualization Benchmark
As we explained in our Xeon Nehalem review, comprehensive real-world server benchmarks that cover the market are beyond what one man can perform. Virtualization benchmarking needs much more manpower, and it is always good to understand the motivation of the group doing the testing. Large OEMs want to show off their latest server platforms, and virtualization software vendors want to show how efficient their hypervisor is. So why did we undertake this odyssey?
This virtualization benchmark was developed by an academic research group called the Sizing Server Lab. (I am also part of this research group.) Part of the lab is academic work; the other part is research that is immediately applied in the field, in this case software developers. The main motivation and objective of the applied research is to tell developers how their own software behaves and performs in a virtual environment. Therefore, the focus of our efforts was to develop a very flexible stress test that tells us how any real-world application behaves in a virtualized environment. A side effect of all this work is that we came up with a virtualization server benchmark, which we think will be very interesting for the readers of AnandTech.
Although the benchmark was a result of research by an academic lab, the most important objectives in designing our own virtualization benchmarks are that they be:
- Repeatable
- Relevant
- Comparable
- Heavy
Repeatable is the hardest one. Server benchmarks tend to run into all kinds of non-hardware related limits such as not enough connections, locking contention, and driver latency. This results in a benchmark that rarely runs at 100% CPU utilization and the CPU percentage load changes for different CPUs. In "Native OS" conditions, this is still quite okay; you can still get a decent idea of how two CPUs perform if one runs at 78% and the other runs at 83% CPU load. However, in virtualization this becomes a complete mess, especially when you have more virtual than physical CPUs. Some VMs will report significantly lower CPU load and others will report significantly higher CPU load when you are comparing two servers. As each VM is reporting different numbers (for example queries per second, transactions per second, and URL/s), average CPU load does not tell you the whole story either. To remedy this, we went through a careful selection of our applications and decided to keep only those benchmarks that allowed us to push the system close to 95-99% load. Note that this was only possible after a lot of tuning.
Comparable: our virtualization benchmark can run on Xen, Hyper-V and ESX.
Heavy: While VMmark and others go for the scenario of running many very light virtual machines with extremely small workloads, we go for a scenario with four or eight VMs. The objective is to find out how the CPUs handle "hard to consolidate" applications such as complex dynamic websites, OnLine Transaction Processing (OLTP), and OnLine Analytical Processing (OLAP) databases.
Most importantly: Relevant. We have been working towards benchmarks using applications that people run every day. In this article we had to make one compromise: as we are comparing the virtualization capabilities of different CPUs, we had to push CPU utilization close to 100%. Few virtualized servers will run close to 100% all the time, but it allows us to be sure that the CPU is the bottleneck. We are using real-world applications instead of benchmarks, but the other side of coin is that this virtualization benchmark is not easily reproducible by third parties. We cannot release the benchmark to third parties, as some of the software used is the intellectual property of other companies. However, we are prepared to fully disclose the details of how we perform the benchmarks to every interested and involved company.
vApus Mark I: the choices we made
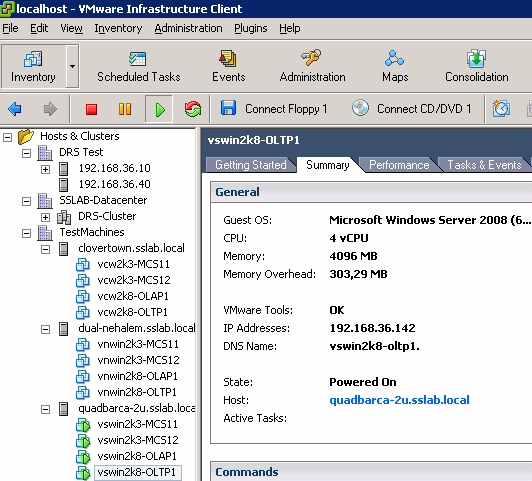
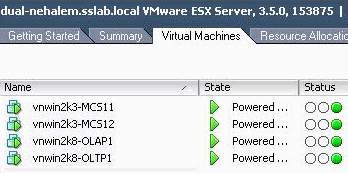
vApus mark I uses only Windows Guest OS VMs, but we are also preparing a mixed Linux and Windows scenario. vApus Mark I uses four VMs with four server applications:
- The Nieuws.be OLAP database, based on SQL Server 2008 x64 running on Windows 2008 64-bit, stress tested by our in-house developed vApus test.
- Two MCS eFMS portals running PHP, IIS on Windows 2003 R2, stress tested by our in house developed vApus test.
- One OLTP database, based on Oracle 10G Calling Circle benchmark of Dominic Giles.
We took great care to make sure that the benchmarks start, run under full load, and stop at the same moment. vApus is capable of breaking off a test when another is finished, or repeating a stress test until the others have finished.
The OLAP VM is based on the Microsoft SQL Server database of the Flemish/Dutch Nieuws.be site, one of the newest web 2.0 websites launched in 2008. Nieuws.be uses a 64-bit SQL Server 2008 x64 database on top of Windows 2008 Enterprise RTM (64-bit). It is a typical OLAP database, with more than 100GB of data consisting of a few hundred separate tables. 99% of the load on the database consists of selects, and about 5% of these are stored procedures. Network traffic is 6.5MB/s average and 14MB/s peak, so our Gigabit connection still has a lot of headroom. DQL (Disk Queue Length) is at 2.0 in the first round of tests, but we only record the results of the subsequent rounds where the database is in a steady state. We measured a DQL close to 0 during these tests, so there is no tangible impact from the storage system. The database is warmed up with 50 to 150 users. The results are recorded while 250 to 700 users hit the database.
The MCS eFMS portal, a real-world facility management web application, has been discussed in detail here. It is a complex IIS, PHP, and FastCGI site running on top of Windows 2003 R2 32-bit. Note that these two VMs run in a 32-bit guest OS, which impacts the VM monitor mode.
Since OLTP testing with our own flexible stress testing software is still in beta, our fourth VM uses a freely available test: "Calling Circle" of the Oracle Swingbench Suite. Swingbench is a free load generator designed by Dominic Giles to stress test an Oracle database. We tested the same way as we have tested before, with one difference: we use an OLTP database that is only 2.7GB large (instead of 9.5GB). We used a 9.5GB database to make sure that locking contention didn't kill scaling on systems with up to 16 logical CPUs. In this case, 2.7GB is enough as we deploy the database on a 4 vCPU VM. Keeping the database relatively small allows us to shrink the SGA size (Oracle buffer in RAM) to 3GB (normally it's 10GB) and the PGA size to 350MB (normally it's 1.6GB). Shrinking the database ensures that our VM is content with 4GB of RAM. Remember that we want to keep the amount of memory needed low so we can perform these tests without needing the most expensive RAM modules on the market. A calling circle test consists of 83% selects, 7% inserts, and 10% updates. The OLTP test runs on the Oracle 10g Release 2 (10.2) 64-bit on top of Windows 2008 Enterprise RTM (64-bit).
Below is a small table that gives you the "native" characteristics that matter for virtualization in each test. (Page management is still being researched.) With "native" we mean the characteristics measured running on the native OS (Windows 2003 and 2008 server) with perfmon.
| Native Performance Characteristics | ||||||
| Native Application / VM | Kernel Time | Typical CPU Load | Interrupt/s | Network | Disk I/O | DQL |
| Nieuws.be / VM1 | 0.65% | 90-100% | 3000 | 1.6MB/s | 0.9MB/s | 0.07 |
| MCS eFMS / VM2 & 3 | 8% | 50-100% | 4000 | 3MB/s | 0.01MB/s | 0 |
| Oracle Calling Circle / VM4 | 17% | 95-100% | 11900 | 1.6MB/s | 3.2MB/s | 0.07 |
Our OLAP database ("Nieuws.be") is clearly mostly CPU intensive and performs very little I/O besides a bit of network traffic. In contrast, the OLTP test causes an avalanche of interrupts. How much time an application spends in the native kernel gives a first rough indication of how much the hypervisor will have to work. It is not the only determining factor, as we have noticed that a lot of page activity is going on in the MCS eFMS application, which causes it to be even more "hypervisor intensive" than the OLTP VM. From the data we gathered, we suspect that the Nieuws.be VM will be mostly stressing the hypervisor by demanding "time slices" as the VM can absorb all the CPU power it gets. The same is true for the fourth "OLTP VM", but this one will also cause a lot of extra "world switches" (from the VM to hypervisor and back) due to the number of interrupts.
The two web portal VMs, which sometimes do not demand all available CPU power (4 cores per VM, 8 cores in total), will allow the hypervisor to make room for the other two VMs. However, the web portal (MCS eFMS) will give the hypervisor a lot of work if Hardware Assisted Paging (RVI, NPT, EPT) is not available. If EPT or RVI is available, the TLBs (Translation Lookaside Buffer) of the CPUs will be stressed quite a bit, and TLB misses will be costly.
As the SGA buffer is larger than the database, very little disk activity is measured. It helps of course that the storage system consist of two extremely fast X25-E SSDs. We only measure performance when all VMs are in a "steady" state; there is a warm up time of about 20 minutes before we actually start recording measurements.
vApus: Virtual Stress Testing
Testing uses real-world databases and websites. To make this as realistic as possible we use vApus. vApus or Virtual Application Unique Stresstest is a stress test developed by Dieter Vandroemme, lead developer of the Sizing Server Lab at the University College of West-Flanders. The basic setup works as follows. Each application is logged during business use in the peak hours. These logs are analyzed by the vApus application and queries/URLs requested are grouped into user actions. vApus will simulate the actual actions that people have done by performing these actions again on the application running on a server in our lab. A well-tuned threading mechanism developed in-house launches one thread per user.
The cool thing is that vApus allows us to perform several completely different stress tests on several servers simultaneously. This is ideal for virtual server testing. Let's discuss this a bit more.
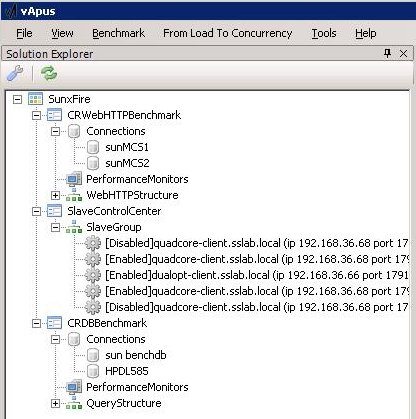
Above you can see the connection to -- in this case -- the Sun XFire 4450 server (which is no longer in our lab). Several performance monitors can be started on each tested server. The CRWebHTTPBenchmark is the first benchmark that will be performed, in our case on virtual servers 2 and 3. The CR means "Continuous Rate": each user will perform an action every second (this is configurable of course). The CRDBBenchmark (the third item under the "SunxFire" connection) is the Continuous Rate benchmark for the Decision Support Database.
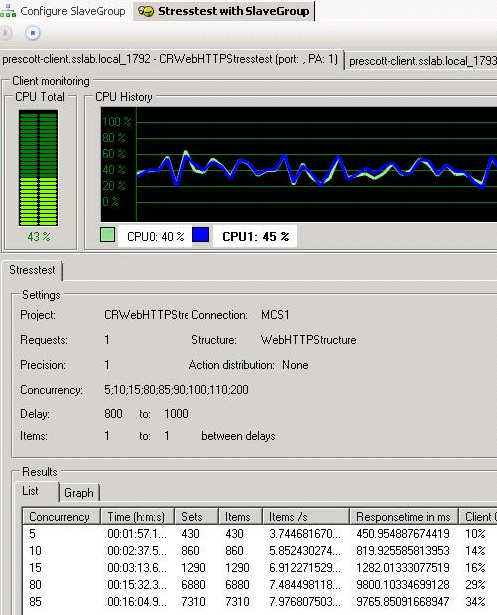
Above you see what the results look like, in this case on one of our slowest servers. Concurrency indicates how many users are hitting the website, and Item/s is the throughput. We constantly monitor the client CPU to make sure that the client machine is never the bottleneck.
The vApus "master" process launches several separate processes called "slaves", which will stress test a separate server or VM. In our case, there are three slaves: two web tests and one database test will all run in parallel. As vApus must be cheap to use, we wanted to avoid situations where you need a massive battery of clients. Besides the fact that every Slave has an extremely tuned threading system to simulate users, each Slave can have affinity set to one or more CPU(s) of the client PC it runs on. For this test, we used two client machines: a quad-core Core 2 Quad Q6600 at 2.4GHz and our old dual Opteron 2.6GHz test system.
As you can see above, we carefully monitor CPU usage so that we are sure that our clients are never the bottleneck. The beauty of this system is that we were able to simulate between…
- 600-800 Database users on VM1
- Two times 80-110 web users on VM2 and VM3
…while running only two clients. Our quad-core client should have been sufficient, but we wanted to play it safe and give each slave at least two CPUs. The two clients and one master are directly connected via a gigabit switch to the test servers.
vApus Mark I vs. VMmark
By now, it should be clear that vApus Mark I is not meant to replace VMmark or VConsolidate. The largest difference is that VMmark for example tries to mimic the "average" virtualized datacenter, while vApus Mark I clearly focuses on the heavier service oriented applications. vApus Mark I focuses on a smaller part of the market, while the creators of VMmark have invested a lot of thought into getting a nice mix of the typical applications found in a datacenter. We have listed the most important differences below.
| vApus Mark I compared to VMmark | ||
| | vApus Mark I | VMmark |
| Goal | Virtualization benchmarking across Guest OS, Hypervisor, and Hardware | Measuring what the best hardware is for ESX |
| Reproducible by third parties | No; for now it's only available to AnandTech and Sizing Server Lab | Yes |
| Modeling | "Harder to virtualize", "heavy duty" applications | A balanced mix of virtualized applications in the "typical" datacenter |
| VMs | Large "heavy duty" VMs; 4GB with 4 VCPUs | Small VMs 0.5-2GB, 1-2 VCPUs |
| Market coverage | Small but important part of the market | Large part of datacenter market |
| Relevance to the real-world | Uses real-world applications | Uses industry standard benchmarks |
The advantages of vApus Mark I are the fact that we use real-world applications and test them as if they are loaded by real people. The advantages of VMmark are that it is available to everyone and it has a mix of applications that is closer to what is found in the majority of datacenters. vApus Mark I focuses more on heavy duty applications.
There's one small difference between the existing benchmarks like VMmark and VConsolidate and our "vApus Mark I" virtual test. VMmark and VConsolidate add additional groups of VMs (called tiles or CSUs) until the benchmark score does not increase anymore, or until all the system processors are fully utilized. Our virtualization benchmark tries to get close to 100% CPU load much quicker. This is a result of the fact that our VMs require relatively large amounts of memory: each VM needs 4GB. If we used a throttled load such as VMmark or VConsolidate, we would require massive amounts of memory to measure servers with 16 cores and more. Six VMs that make up a tile in VMmark take only 5GB, while our four VMs require 16GB. Our current monitoring shows that this benchmark could run in 10-11GB, and thanks to VMware's shared memory technique probably less than 9GB. With four VMs we can test up to 12 physical CPUs, or 16 logical CPUs (8 Physical + 8 SMT). We need eight VMs (or two "tiles") to fully stress 16 to 24 physical cores.
Benchmarked Hardware Configurations
Below you can find the configuration of the servers we used. The reason that we used 24GB is that we immediately started testing with two tiles (eight VMs) after the first tests. VMs together with the Nieuws.be OLAP databases are stored on two 1TB WDC WD1000FYPS SATA hard drives; the OLTP databases are on an Intel X25-E SSD while the logs are on a separate X25-E SSD. As our measurement show, DQL is very low thanks to this storage setup.
All tests are conducted on ESX 3.5 Update 4 (Build 153875).
Xeon Server 1: ASUS RS700-E6/RS4 barebone
(Additional information on this server)
Dual Intel Xeon "Gainestown" X5570 2.93GHz
ASUS Z8PS-D12-1U
6x4GB (24GB) ECC Registered DDR3-1333
NIC: Intel 82574L PCI-E Gbit LAN
Xeon Server 2: Intel "Stoakley platform" server
Dual Intel Xeon E5450 "Harpertown" at 3GHz
Supermicro X7DWE+/X7DWN+
24GB (12x2GB) Crucial Registered FB-DIMM DDR2-667 CL5 ECC
NIC: Dual Intel PRO/1000 Server NIC
Xeon Server 3: Intel "Bensley platform" server
Dual Intel Xeon X5365 "Clovertown" 3GHz
Dual Intel Xeon L5320 at 1.86GHz
Dual Intel Xeon 5080 "Dempsey" at 3.73GHz
Supermicro X7DBE+
24GB (12x2GB) Crucial Registered FB-DIMM DDR2-667 CL5 ECC
NIC: Dual Intel PRO/1000 Server NIC
Opteron Server: Supermicro SC828TQ-R1200LPB 2U Chassis
Dual AMD Opteron 8389 at 2.9GHz
Dual AMD Opteron 2222 at 3.0GHz
Dual AMD Opteron 8356 at 2.3GHz
Supermicro H8QMi-2+
24GB (12x2GB) DDR2-800
NIC: Dual Intel PRO/1000 Server NIC
vApus/DVD Store/Oracle Calling Circle Client Configuration
Intel Core 2 Quad Q6600 2.4GHz
Foxconn P35AX-S
4GB (2x2GB) Kingston DDR2-667
NIC: Intel PRO/1000
Heavy Virtualization Benchmarking
All tests run on ESX 3.5 Update 4 (Build 153875), which has support for AMD's RVI. It also supports the Intel Xeon X55xx Nehalem but has no support yet for EPT.
Getting one score out of a virtualized machine is not straightforward: you cannot add up URL/s, transactions per second, and queries per second. If virtualized system A turns out twice as many web responses but fails to deliver half of the transactions machine B delivers, which one is the fastest? Luckily for us, Intel (vConsolidate) and VMware (VMmark) have already solved this problem. We use a very similar approach. First, we test each application on its native operating system with four physical cores. Those four physical cores belong to one Opteron Shanghai 8389 2.9GHz. This becomes our reference score.
| Opteron Shanghai 8389 2.9GHz Reference System | |
| Test | Reference score |
| OLAP - Nieuws.be | 175.3 Queries /s |
| Web portal - MCS | 45.8 URL/s |
| OLTP - Calling Circle | 155.3 Transactions/s |
We then divide the score of the first VM by the "native" score. In other words, divide the number of queries per second in the first OLAP VM by the number of queries that one Opteron 8389 2.9GHz gets when it is running the Nieuws.be OLAP Database.
| Performance Relative to Reference System | ||||
| Server System Processors | OLAP VM | Web portal VM 2 | Web portal VM 3 | OLTP VM |
| Dual Xeon X5570 2.93 | 94% | 50% | 51% | 59% |
| Dual Xeon X5570 2.93 HT off | 92% | 43% | 43% | 43% |
| Dual Xeon E5450 3.0 | 82% | 36% | 36% | 45% |
| Dual Xeon X5365 3.0 | 79% | 35% | 35% | 32% |
| Dual Xeon L5350 1.86 | 54% | 24% | 24% | 20% |
| Dual Xeon 5080 3.73 | 47% | 12% | 12% | 7% |
| Dual Opteron 8389 2.9 | 85% | 39% | 39% | 51% |
| Dual Opteron 2222 3.0 | 50% | 17% | 17% | 12% |
So for example, the OLAP VM on the dual Opteron 8389 got a score of 85% of that of the same application running on one Opteron 8389. As you can see the web portal server only has 39% of the performance of a native machine. This does not mean that the hypervisor is inefficient, however. Don't forget that we gave each VM four virtual CPUs and that we have only eight physical CPUs. If the CPUs are perfectly isolated and there was no hypervisor, we would expect that each VM gets 2 physical CPUs or about 50% of our reference system. What you see is that OLAP VM and OLTP VM "steal" a bit of performance away from the web portal VMs.
Of course, the above table is not very user-friendly. To calculate one vApus Mark I score per physical server we take the geometric mean of all those percentages, and as we want to understand how much work the machine has done, we multiply it by 4. There is a reason why we take the geometric mean and not the arithmetic mean. The geometric mean penalizes systems that score well on one VM and very badly on another VM. Peaks and lows are not as desirable as a good steady increase in performance over all virtual machines, and the geometric mean expresses this. Let's look at the results.
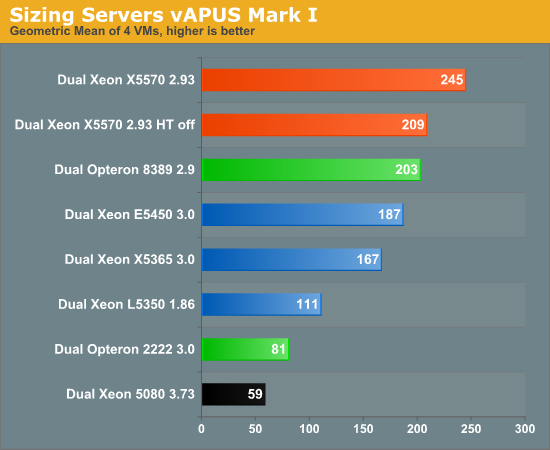
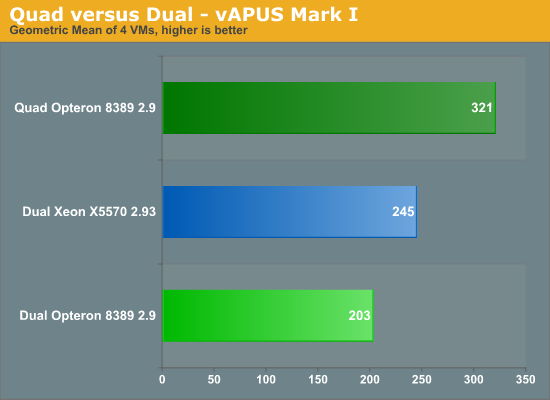
After seeing so many VMmark scores, the result of vApus Mark I really surprised us. The Nehalem based Xeons are still the fastest servers, but do not crush the competition as we have witnessed in VMmark and VConsolidate. Just to refresh your memory, here's a quick comparison:
| VMmark vs. vApus Mark I Summary | ||
| Comparison | VMmark | vApus Mark I |
| Xeon X5570 2.93 vs. Xeon 5450 3.0 | 133-184% faster (*) | 31% faster |
| Xeon X5570 2.93 vs. Opteron 8389 2.9 | +/- 100% faster (*)(**) | 21% faster |
| Opteron 8389 2.9 vs. Xeon 5450 3.0 | +/- 42% | 9% faster |
(*) Xeon X5570 results are measured on ESX 4.0; the others are on ESX 3.5.
(**) Xeon X5570 best score is 108% faster than Opteron at 2.7GHz. We have extrapolated the 2.7GHz scores to get the 2.9GHz ones.
Our first virtualization benchmark disagrees strongly with the perception that the large OEMs and recent press releases have created with the VMmark scores. "Xeon 54xx and anything older are hopelessly outdated virtualization platforms, and the Xeon X55xx make any other virtualization platform including the latest Opteron 'Shanghai' look silly". That is the impression you get when you quickly glance over the VMmark scores.
However, vApus Mark I tells you that you should not pull your older Xeons and newer Opterons out of your rack just yet if you are planning to continue to run your VMs on ESX 3.5. This does not mean that either vApus Mark I or VMmark is wrong, as they are very different benchmarks, and vApus Mark I was run exclusively on ESX 3.5 update 4 while some of the VMmark scores have been run on vSphere 4.0. What it does show us how important it is to have a second data point and a second independent "opinion". That said, the results are still weird. In vApus Mark I, Nehalem is no longer the ultimate, far superior virtualization platform; at the same time, the Shanghai Opteron does not run any circles around the Xeon 54xx. There is so much to discuss that a few lines will not do the job. Let's break things up a bit more.
Analysis: "Nehalem" vs. "Shanghai"
The Xeon X5570 outperforms the best Opterons by 20% and 17% of the gain comes from Hyper-Threading. That's decent but not earth shattering. Let us first set expectations. What should we have expected from the Xeon X5570? We can get a first idea by looking at the "native" (non-virtualized) scores of the individual workloads. Our last Server CPU roundup showed us that the Xeon X5570 2.93GHz is (compared to a Xeon E5450 3GHz):
- 94% faster in Oracle Calling Circle
- 107% faster in a OLAP SQL Server benchmark
- 36% faster on the MCS eFMS web portal test
If we would simply take a geometric mean of these benchmarks and forget we are running on top of a hypervisor, we would expect a 65% advantage for the Xeon X5570. Our virtualization benchmark shows a 31% advantage for the Xeon X5570 over the Xeon 5450. What happened?
It seems like all the advantages of the new platforms such as fast CPU interconnects, NUMA, integrated memory controllers, and L3 caches for fast syncing have evaporated. In a way, this is the case. You have probably noticed the second flaw (besides ignoring the hypervisor) in the reasoning above. That second flaw consists in the fact that the "native scores" in our server CPU roundup are obtained on eight (16 logical) physical cores. Assuming that four virtual CPUs will show the same picture is indeed inaccurate. The effect of fast CPU interconnects, NUMA, and massive bandwidth increases will be much less in a virtualized environment where you limit each application to four CPUs. In this situation, if the ESX scheduler is smart (and that is the case) it will not have to sync between L3 caches and CPU sockets. In our native benchmarks, the application has to scale to eight CPUs and has to keep the caches coherent over two sockets. This is the first reason for the less than expected performance gain: the Xeon 5570 cannot leverage some of its advantages such as much quicker "syncing".
The fact that we are running on a hypervisor should give the Xeon X5570 a boost. The Nehalem architecture switches about 40% quicker back and forth to the hypervisor than the Xeon 54xx. It cannot leverage its best weapon though: Extended Page Tables are not yet supported in ESX 3.5 Update 4. They are supported in vSphere's ESX 4.0, which immediately explains why OEMs prefer to run VMmark on ESX 4.0. Most of our sources tell us that EPT gives a boost of about 25%. To understand this fully, you should look at our Hardware virtualization: the nuts and bolts article. The table below tells what mode the VMM (Virtual Machine Monitor), a part of the hypervisor, runs. To refresh your memory:
- SVM: Secure Virtual Machine, hardware virtualization for the AMD Opteron
- VT-x: Same for the Intel Xeon
- RVI: also called nested paging or hardware assisted paging (AMD)
- EPT: Extended Page Tables or hardware assisted paging (Intel)
- Binary Translation: well tweaked software virtualization that runs on every CPU, developed by VMware
| Hypervisor VMM Mode | ||
| ESX 3.5 Update 4 | 64-bit OLTP & OLAP VMs | 32-bit Web portal VM |
| Quad-core Opterons | SVM + RVI | SVM + RVI |
| Xeon 55xx | VT-x | Binary Translation |
| Xeon 53xx, 54xx | VT-x | Binary Translation |
| Dual-core Opterons | Binary Translation | Binary Translation |
| Dual-core Xeon 50xx | VT-x | Binary Translation |
Thanks to being first with hardware-assisted paging, AMD gets a serious advantage in ESX 3.5: it can always leverage all of its virtualization technologies. Intel can only use VT-x with the 64-bit Guest OS. The early VT-x implementations were pretty slow, and VMware abandoned VT-x for 32-bit guest OS as binary translation was faster in a lot of cases. The prime reason why VMware didn't ditch VT-x altogether was the fact that Intel does not support segments -- a must for binary translation -- in x64 (EM64T) mode. This makes VT-x or hardware virtualization the only option for 64-bit guests. Still, the mediocre performance of VT-x on older Xeons punishes the Xeon X5570 in 32-bit OSes, which is faster with VT-x than with binary translation as we will see further.
So how much performance does the AMD Opteron extract from the improved VMM modes? We checked by either forcing or forbidding the use of "Hardware Page Table Virtualization", also called Hardware Virtualized MMU, EPT, NPT, RVI, or HAP.
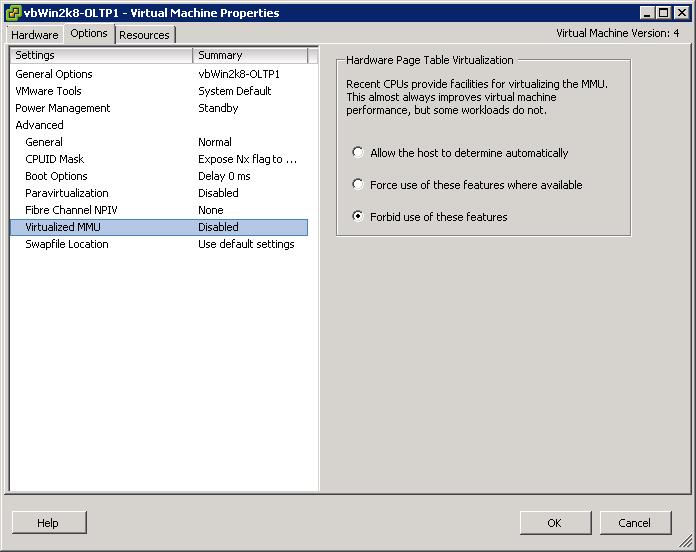 |
Let's first look at the AMD Opteron 8389 2.9GHz. When you disable RVI, memory page management is handled the same as all the other "privileged instructions" with hardware virtualization: it causes exceptions that make the hypervisor intervene. Each time you get a world switch towards the hypervisor. Disabling RVI makes the impact of world switches more important. When you enable RVI, the VMM exposes all page tables (Virtual, Guest Physical, and "machine" physical) to the CPU. It is no longer necessary to generate (costly) exceptions and switches to the hypervisor code.
However, filling the TLB is very costly with RVI. When a certain logical page address or virtual address misses the TLB, the CPU performs a lookup in the guest OS page tables. Instead of the right physical address, you get a "Guest Physical address", which is in fact a virtual address. The CPU has to search the Nested Pages ("Guest Physical" to "Real Physical") for the real physical address, and it does this for each table lookup.
To cut a long story short, it is very important to keep the percentage of TLB hits as high as possible. One way to do this is to decrease the number of memory pages with "large pages". Large pages mean that your memory is divided into 2MB pages (x86-64, x86-32 PAE) instead of 4KB. This means that Shanghai's L1 TLB can cover 96MB data (48 entries times 2MB) instead of 192 KB! Therefore, if there are a lot of memory management operations, it might be a good idea to enable large pages. Both the application and the OS must support this to give good results.
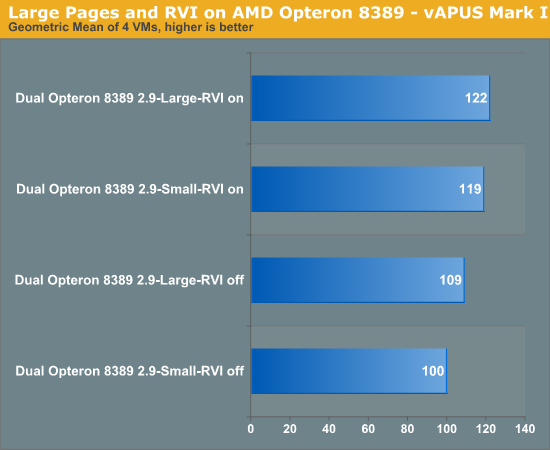
The effect of RVI is pretty significant: it improves our vApus Mark I score by almost 20%. The impact of large pages is rather small (3%), and this is probably a result of Shanghai's large TLB, consisting of a 96 entry (48 data, 48 instructions) L1 and a 512 entry L2 TLB. You could say there is less of a need for large pages in the case of the Shanghai Opteron.Inquisitive Minds Want to Know
Tynopik, a nickname for one of our readers, commented: "Is Nehalem better at virtualization simply because it's a faster CPU? Or are the VM-specific enhancements making a difference?" For some IT professionals that might not matter, but many of our readers are very keen (rightfully so!) to understand the "why" and "how". Which characteristics make a certain CPU a winner in vApus Mark I? What about as we make further progress with our stress testing, profiling, and benchmarking research for virtualization in general?
Understanding how the individual applications behave would be very interesting, but this is close to impossible with our current stress test scenario. We give each of the four VMs four virtual CPUs, and there are only eight physical CPUs available. The result is that the VMs steal time from each other and thus influence each other's results. It is therefore easier to zoom in on the total scores rather than the individual scores. We measured the following numbers with ESXtop:
| Dual Opteron 8389 2.9GHz CPU Usage | |
| | Percentage of CPU Time |
| Web portal VM1 | 19.8 |
| Web portal VM2 | 19.425 |
| OLAP VM | 27.2125 |
| OLTP VM | 27.0625 |
| Total "Work" | 93.5 |
| "Pure" Hypervisor | 1.9375 |
| Idle | 4.5625 |
The "pure" hypervisor percentage is calculated as what is left after subtracting the work that is done in the VMs and the "idle worlds". The work done in the VMs includes the VMM, which is part of the hypervisor. It is impossible, as far as we know, to determine the exact amount of time spent in the guest OS and in the hypervisor. That is the reason why we speak of "pure" hypervisor work: it does not include all the hypervisor work, but it is the part that happens in the address space of the hypervisor kernel.
Notice how the scheduler of ESX is pretty smart as it gives the more intensive OLAP and OLTP VMs more physical CPU time. You could say that those VMs "steal" a bit of time from the web portal VMs. The Nehalem based Xeons shows very similar numbers when it comes to CPU usage:
| Dual Xeon X5570 CPU Usage (no Hyper-Threading) | |
| | Percentage of CPU time |
| Web portal VM1 | 18.5 |
| Web portal VM2 | 17.88 |
| OLAP VM | 27.88 |
| OLTP VM | 27.89 |
| Total "Work" | 92.14 |
| "Pure" Hypervisor | 1.2 |
| Idle | 6.66 |
With Hyper-Threading, we see something interesting. VMware ESXtop does not count the "Hyper-Threading CPUs" as real CPUs but does see that the CPUs are utilized better:
| Dual Xeon X5570 CPU Usage (Hyper-Threading Enabled) | |
| | Percentage of CPU time |
| Web portal VM1 | 20.13 |
| Web portal VM2 | 20.32 |
| OLAP VM | 28.91 |
| OLTP VM | 28.28 |
| Total "Work" | 97.64 |
| "Pure" Hypervisor | 1.04 |
| Idle | 1.32 |
Idle time is reduced from 6.7% to 1.3%.
The Xeon 54XX: no longer a virtualization wretch
It's also interesting that VMmark tells us that the Shanghais and Nehalems are running circles around the relatively young Xeon 54xx platform, while our vApus Mark I tells us that while the Xeon 54xx might not be the first choice for virtualization, it is nevertheless a viable platform for consolidation. The ESXtop numbers you just saw gives us some valuable clues, and the Xeon 54xx "virtualization revival" is a result of the way we test now. Allow us to explain.
In our case, we have eight physical cores with four VMs and four vCPUs each. So on average the hypervisor has to allocate two physical CPUs to each virtual machine. ESXtop shows us that the scheduler plays it smart. In many cases, a VM gets one dual-core die on the Xeon 54xx, and cache coherency messages are exchanged via a very fast shared L2 cache. ESXtop indicates quite a few "core migrations" but never "socket migrations". In other words, the ESX scheduler keeps the virtual machines on the same cores as much as possible, keeping the L2 cache "warm". In this scenario, the Xeon 5450 can leverage a formidable weapon: the very fast and large 6MB that each two cores share. In contrast, two cores working on the same VM have to content themselves with a tiny 512KB L2 and a slower and a smaller L3 cache (4MB per two cores) on Nehalem. The way we tested right now is probably the best case for the Xeon 54xx Harpertown. We'll update with two and three tile results later.
Quad Opteron: room for more
Our current benchmark scenario is not taxing enough for a quad Opteron server:
| Quad Opteron 8389 CPU Usage | |
| | Percentage of CPU time |
| Web portal VM1 | 14.70625 |
| Web portal VM2 | 14.93125 |
| OLAP VM | 23.75 |
| OLTP VM | 23.625 |
| Total "Work" | 77.0125 |
| "Pure" Hypervisor | 2.85 |
| Idle | 21.5625 |
Still, we were curious how a quad machine would handle our virtualization workload, even at 77% CPU load. Be warned that the numbers below are not accurate, but give some initial ideas.
Despite the fact that we are only using 77% of the four CPUs compared to the 94-97% on Intel, the quad socket machine remains out of reach of the dual CPU systems. The quad Shanghai server outperforms the best dual socket Intel by 31% and improves performance by 58% over its dual socket sibling. We expect that once we run with two or three "tiles" (8 or 12 VMs), the quad socket machine will probably outperform the dual shanghai by -- roughly estimated -- 90%. Again, this is a completely different picture than what we see in VMmark.
Caches, Memory Bandwidth, or Pure Clock Speed?
We currently only have one Xeon 55xx in the lab, but we have four different CPUs based on the AMD "K10" architecture. That allows us to do some empirical testing to find out what makes the most impact: larger caches, faster memory, or mostly clock speed?
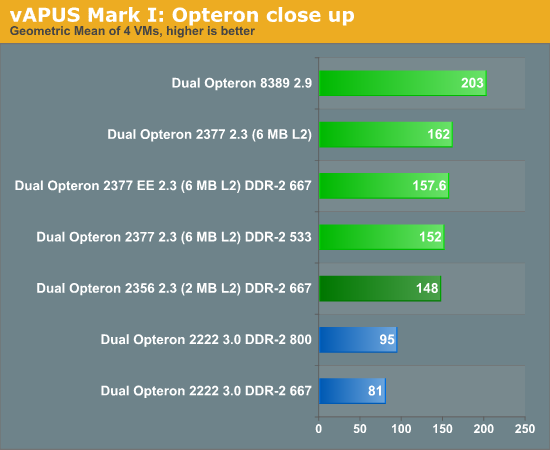
Every bit of extra clock speed seems to benefit our test. Bandwidth has a smaller effect. Even if we reduce the bandwidth of the Shanghai Opteron by one third, the score only lowers by 6%. Given that we only run four VMs this seems reasonable. Shanghai got three times as much L3 cache, a faster L3 cache, DDR2-800 instead of DDR2-667, and lower world switch times. The Opteron 2377 2.3GHz allows us to test at the same clock speed: the Shanghai Opteron is about 9.5% faster clock-for-clock than the Barcelona chip. If we run both chips with the same memory, the Shanghai Opteron is 6.5% faster. That's a small difference, but the Opteron EE promises much lower power consumption (40W ACP, 60W TDP) than the Barcelona chip (75W ACP, 115W TDP).
Notice that the Dual Opteron is a lot more bandwidth sensitive: improve bandwidth by 20% and you get 14% higher performance. Four VMs are fighting for only 4x1MB of cache, while running on the dual "Shanghai" Opteron each VM in theory has two 512KB L2 caches plus a 3MB chunk of L3.
Conclusions so Far
Both VMmark and vApus Mark I seem to give results that are almost black and white. They give you two opposite and interesting data points. When you are consolidating extremely high numbers of VMs on one physical server, the Xeon Nehalem annihilates, crushes, and walks over all other CPUs including its own older Xeon brothers… if it is running VMware ESX 4.0 (vSphere). Quickly looking at the VMmark results posted so far seems to suggest you should just rip your old Xeon and Opteron servers out of the rack and start again with the brand-spanking new Nehalem Xeon. I am exaggerating, but the contrast with our own virtualization benchmarking was quite astonishing.
vApus Mark I gives the opposite view: the Xeon Nehalem is without a doubt the fastest platform, but the latest quad-core Opteron is not far behind. If your applications are somewhat similar to the ones we used in vApus mark I, pricing and power consumption may bring the Opteron Shanghai and even the Xeon 54xx back into the picture. However, we are well aware that the current vApus Mark I has its limitations. We have tested on ESX 3.5 Update 4, which is in fact the only available hypervisor from VMware right now. For future decisions, we admit that testing on ESX 4.0 is a lot more relevant, but that does not mean that the numbers above are meaningless. Moving towards a new virtualization platform is not something even experienced IT professionals do quickly. Many scripts might not work properly anymore, the default virtualization hardware is not compatible between the hypervisor, etc. For example, ESX 3.5 servers won't recognize the version 7 hardware from ESX 4 VMs. In a nutshell: if ESX 3.5 is your most important hypervisor platform, both the Xeon 55xx, 54xx, and quad-core Opteron are very viable platforms.
It is also interesting to see the enormous advances CPUs have made in the virtualization area:
- The latest Xeon 55xx of early 2009 is about 4.2 times faster than the best 3.7GHz dual-core Xeons of early 2006.
- The latest Opterons are 2.5 times better than the slightly faster clocked 3.0GHz dual-core Opterons of mid 2007, and based on this we calculate that they are about 3 times faster than their three year older brothers.
Moving from the 3-4 year old dual-core servers towards the newest quad-core Opterons/Xeons will improve the total performance of your server by about 3 to 4 times.

What about ESX 4.0? What about the hypervisors of Xen/Citrix and Microsoft? What will happen once we test with 8 or 12 VMs? The tests are running while I am writing this. We'll be back with more. Until then, we look forward to reading your constructive criticism and feedback.
I would like to thank Tijl Deneut for assisting me with the insane amount of testing and retesting; Dieter Vandroemme for the excellent programming work on vApus; and of course Liz Van Dijk and Jarred Walton for helping me with the final editing of this article.


I got a good answer from the above description,but it still requires some more update to be made. Please share more content on MSBI Online Training Hyderabad
ReplyDeleteTül perde modelleri
ReplyDeleteNumara Onay
mobil ödeme bozdurma
nft nasıl alınır
ANKARA EVDEN EVE NAKLİYAT
TRAFİK SİGORTASİ
DEDEKTÖR
web sitesi kurma
aşk kitapları
Smm panel
ReplyDeleteSmm panel
iş ilanları
instagram takipçi satın al
hirdavatciburada.com
WWW.BEYAZESYATEKNİKSERVİSİ.COM.TR
SERVİS
Jeton Hilesi İndir